UFC Betting With Statistics: A Data-Driven Approach to MMA Wagering
 Available in US

Numbers Do Not Lie — But They Do Mislead If You Read Them Wrong
The first spreadsheet I built for UFC betting had 14 columns and predicted fight outcomes with the confidence of a man who had just discovered significant strike differential. It was terrible. I went 4-8 over my first month using it and nearly abandoned the data-driven approach entirely. The problem was not that statistics do not work for MMA — they absolutely do. The problem was that I was using the wrong statistics, weighting them incorrectly, and ignoring the context that gives numbers meaning.
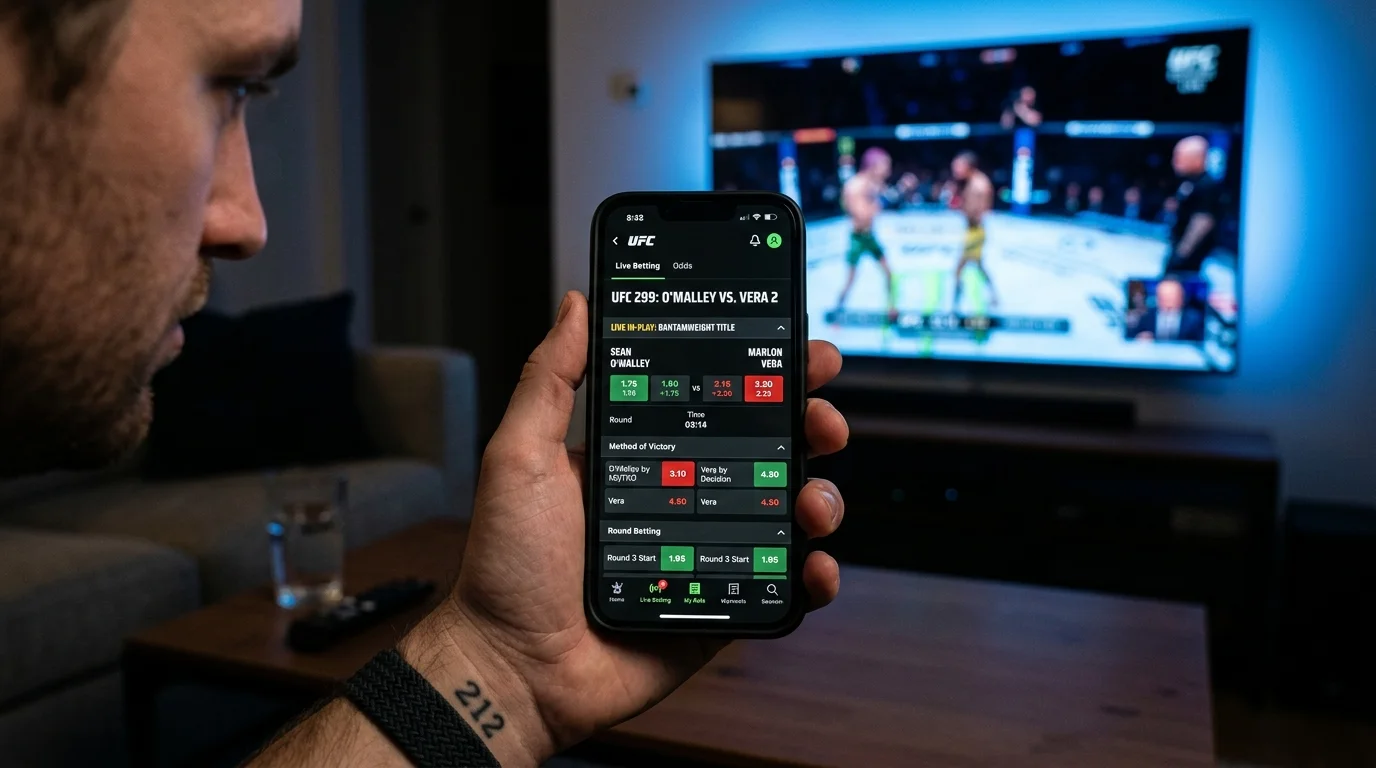
The UFC Event Centre now delivers over 50 live statistics per fight, and Sportradar’s partnership has expanded the data available to bookmakers and the public alike. Eduard Blonk, Sportradar’s Chief Commercial Officer, described the data expansion as helping to “unlock more dynamic in-play betting opportunities” — and he is right, but only for bettors who understand which numbers matter and which are noise. This article covers the statistics that actually predict UFC outcomes and the ones that look important but lead you astray.
See also: bet on ufc fights for data-driven MMA analysis.
The Statistics That Predict UFC Outcomes
After years of building and testing models, I have narrowed my core inputs to a handful of statistics that have predictive power above noise level.
Significant strike accuracy differential is the single most informative statistic for UFC moneyline prediction. Not total significant strikes — accuracy. A fighter who lands 48% of their significant strikes against an opponent who lands 38% has a substantial advantage, because accuracy reflects both offensive skill and defensive ability. Volume alone is misleading: a fighter can throw 200 strikes and land 60 (30%) while their opponent throws 100 and lands 50 (50%). The lower-volume, higher-accuracy fighter is often winning the fight on the scorecards and doing more damage per exchange.
Takedown defence percentage is the second most valuable input, particularly for matchups involving a grappler. A fighter with 85% takedown defence against a wrestler who averages three attempts per fight is likely to keep the fight standing — which changes every other variable in the analysis. Takedown defence is also more stable across fights than takedown offence, making it a more reliable predictor.
Strikes absorbed per minute is a durability metric that correlates with knockout vulnerability. Fighters who absorb more strikes tend to get finished more often, which is useful for method-of-victory and over/under rounds predictions. But this statistic needs context: a fighter who absorbs 4.5 strikes per minute while moving backward and rolling with punches is in a very different situation from one absorbing the same volume while standing flat-footed in the pocket.
The Statistics That Mislead
Reach advantage is the most overrated statistic in casual UFC analysis. A three-inch reach advantage sounds meaningful, but the correlation between reach differential and fight outcome is weak — less than 0.1 in most studies I have run. Reach matters only when the fighter with the advantage knows how to use it (long jabs, straight punches at distance), and even then, it is overwhelmed by other factors like hand speed, footwork, and cage cutting ability. I removed reach from my model in 2021 and my prediction accuracy improved.
Win-loss record is another misleading surface statistic. A 15-2 record looks impressive until you learn that 13 of those wins came in regional promotions against opponents with losing records. The quality of opposition is more important than the win total, and the UFC-specific record (how the fighter has performed since entering the promotion) is more informative than the career record. I weight the most recent three to five UFC bouts far more heavily than anything before them.
Age is commonly cited but poorly applied. The conventional wisdom is “younger fighters are better,” but the relationship between age and UFC performance is not linear. Fighters improve rapidly in their late twenties, peak between 28-33, and decline at varying rates after that. A 35-year-old wrestler with strong defensive skills may decline far more slowly than a 35-year-old athlete who relies on speed and reflexes. Using age as a blunt input — “this fighter is old, therefore bet against them” — introduces more noise than signal.
Building a Simple Statistical Model for UFC Bets
You do not need machine learning or programming skills to use statistics effectively in UFC betting. A spreadsheet with five columns can outperform gut-feel betting if the columns contain the right information.
My starter model uses: significant strike accuracy differential (fighter A minus fighter B), takedown defence percentage for both fighters, strikes absorbed per minute for both fighters, and the divisional base finish rate. Each input produces a directional lean (fighter A advantage or fighter B advantage), and the combined lean generates a probability estimate that I compare to the bookmaker’s implied probability.
The model does not predict the future. It identifies when the market’s pricing disagrees with what the historical data supports. When my model says fighter A has a 58% chance of winning and the bookmaker’s odds imply 50%, I have a potential value bet. When the model and the market agree within two or three percentage points, I pass. The model is a filter, not an oracle.
In 2024, the UFC held 517 fights across 42 events. That is a large enough dataset to test a model’s accuracy within a single season. I back-test every model adjustment against the previous 12 months of fights before applying it to live betting. If the adjustment does not improve historical prediction accuracy, it does not go into the model — regardless of how theoretically sound it seems.
Where Statistics End and Film Study Begins
The best UFC bettors I know use statistics as the first pass and film study as the second. The numbers tell you what happened. The film tells you why. A fighter with declining significant-strike accuracy might be slowing down — or they might have changed coaches and adopted a more patient, counter-striking style that lands fewer but more consequential shots. Only watching the recent fights reveals which narrative is correct.
I watch the last three fights of every fighter I am considering betting on, at minimum. Not highlights — full fights. I am looking for things the statistics cannot capture: how a fighter responds when hurt, whether they panic in scrambles, how they manage distance when tired, whether they freeze against southpaw opponents or aggressive pressure. These qualitative inputs adjust my statistical probability estimate by 5-10 percentage points in either direction, which is often the difference between a bet that clears my value threshold and one that does not.
The combination of statistical screening and film study is more time-consuming than either approach alone, but it produces results that neither can match independently. Statistics without context produce false confidence. Film study without numbers produces unfalsifiable opinions. The intersection — where the data points one direction and the film confirms or contradicts it — is where the edge lives.
Tracking Your Results and Iterating
A data-driven approach requires data-driven self-evaluation. Every bet I place goes into a tracking spreadsheet with the date, event, fighters, market, stake, odds, my estimated probability, and the outcome. At the end of each quarter, I review the data to answer three questions: was my win rate above or below expectation? Were my probability estimates calibrated (did events I rated at 60% actually occur 60% of the time)? And where were my biggest errors — which fights did I get most wrong, and why?
See also: plan your bets around the UFC event schedule for UK viewers.
This review process has reshaped my model multiple times. In 2022, I discovered I was systematically overvaluing knockout power at bantamweight, leading to poor over/under rounds predictions. In 2023, I found that my takedown-defence weighting was too low, causing me to underestimate wrestlers. Each correction made the model marginally better, and those marginal improvements compound over hundreds of bets. The UFC betting strategy guide connects these data principles to a broader decision framework for all market types.
What is the most important UFC statistic for betting?
Significant strike accuracy differential — the gap between fighter A’s landing percentage and fighter B’s. This single metric captures both offensive precision and defensive ability, and it has the strongest correlation with fight outcomes among publicly available statistics. Volume of strikes matters less than the percentage that land cleanly.
Do I need programming skills to build a UFC betting model?
No. A basic spreadsheet with five or six columns is sufficient for a functional model. The key inputs are significant strike accuracy differential, takedown defence percentages, strikes absorbed per minute, and the divisional base finish rate. The analytical value comes from selecting the right inputs and comparing your probability estimates to the bookmaker’s odds, not from technical complexity.
Created by the ”bet on ufc Fights” editorial team.